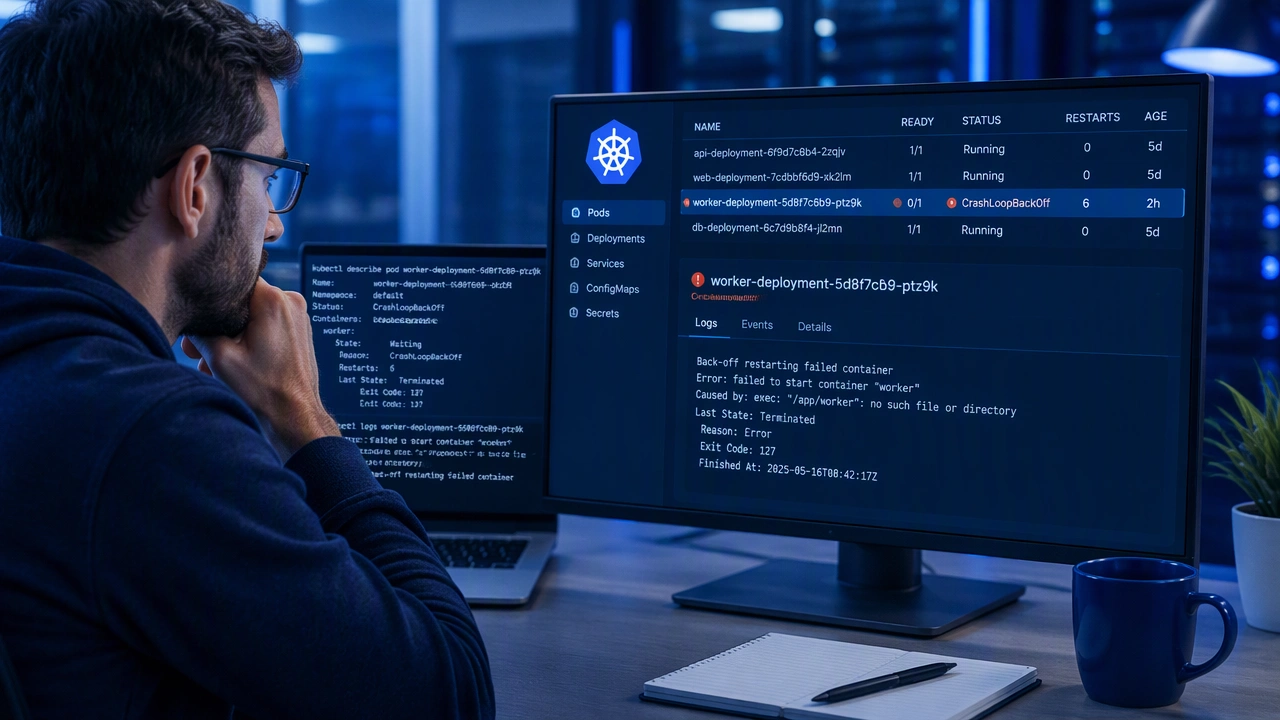
How to Diagnose CrashLoopBackOff in Kubernetes Pods Step by Step

CrashLoopBackOff is one of the most common signals that something is wrong with a containerized workload. It means the container started, then exited, and Kubernetes is delaying the next restart to avoid a tight restart loop. For IT administration teams keeping systems running, the condition is useful because it points to a concrete failure, but the message itself rarely explains the cause. The restart is an outcome; the evidence usually sits elsewhere.
This guide explains how to diagnose CrashLoopBackOff in Kubernetes pods step by step, using logs, events, status output, and configuration checks in a deliberate order.
Confirm the symptom and capture the current state
Start by identifying the exact workload and pod. Record the namespace, pod name, restart count, current phase, and the number of times the container has started. The pod may have been recreated by a Deployment or ReplicaSet, so use the stable workload name when investigating history rather than relying only on one ephemeral pod name.
Before changing anything, capture the state you are seeing. Save the output of the pod description, the container statuses, and the recent events. If the pod is being recreated continuously, note the start and exit times so you can line them up with application and platform events.
Check pod status and container states
Look at the Waiting reason and message for each container. The reason may be CrashLoopBackOff, but a sidecar, init container, or ephemeral container can also be the failing component. Check the exit code, signal, and last termination time. A normal exit with a non-zero code suggests the application ended on its own; a signal often indicates an external termination or a fatal runtime condition.
Pay attention to whether the container reached a ready state before restarting. A container that becomes ready and later exits is different from one that fails during startup.
Read the logs that explain the exit
Logs are the first source of application-level evidence. Request both current logs and logs from the previous container instance. The previous logs matter because the failing run may have produced the only useful error before the process disappeared.
Collect current and previous logs
Use the container name explicitly when a pod has multiple containers. Review the final lines before termination, along with warnings and stack traces. Look for missing files, invalid values, refused connections, authentication failures, and unhandled exceptions.
If logs end abruptly with no application error, consider whether the process is being terminated before it can flush output. That pattern shifts attention toward probes, resource limits, or platform-level termination.
Separate startup errors from runtime errors
Classify what you find. Startup errors often include missing configuration, invalid command arguments, database incompatibility, or a port already in use. Runtime errors may point to memory pressure, a dependency outage, or a crash after handling the first request. The timing of the exit helps determine which investigation path to take.
Use Kubernetes events as a timeline
Events show what the control plane and kubelet observed around each restart. Review scheduled, pulled, created, started, failed, and back-off events together. A repeated pattern of creation followed by a fast exit usually means the application is failing quickly. A delayed start may point to image pulls, node pressure, or resource constraints.
Check for probe failures and restart triggers
Compare probe failures with restart times. If readiness or liveness probes fail, the platform may intentionally restart the container. A liveness probe with an aggressive timeout or a path that requires a slow dependency can turn a healthy process into a restart loop. Verify the probe path, port, initial delay, timeout, period, and failure threshold.
Look for node and resource pressure
Inspect node conditions, disk pressure, memory pressure, and pod resource requests or limits. An out-of-memory termination can look like an application crash even when the code is correct. Compare the container restart time with node events and recent scheduling changes.
Validate configuration before changing code
Many restart loops are configuration problems rather than defects in the application. Review environment variables, mounted files, secret references, and command arguments as they are actually rendered in the pod.
Inspect environment variables and mounted files
Confirm that required variables exist, are spelled correctly, and contain usable values. Check that referenced secrets and config maps exist in the same namespace and that the mounted paths match what the application expects. File permissions, malformed JSON or YAML, and expired credentials are common causes of immediate exits.
Review image, command, and arguments
Verify that the image tag is the intended version and that the image can run on the selected node architecture. Confirm the entrypoint and arguments have not changed. A correct image with an incorrect working directory, shell, or command can fail before the application starts.
Trace the exit with a structured decision path
Use the evidence to narrow the cause in order:
- Exit immediately after start: inspect configuration, secrets, image command, and startup dependencies.
- Probe failures before restart: adjust probe timing or fix the endpoint, then verify readiness separately from liveness.
- Out-of-memory or eviction: compare limits and usage, check node pressure, and review recent traffic or batch changes.
- Dependency unavailable: confirm DNS, network policy, service endpoints, database migrations, and external credentials.
- Permission or filesystem errors: validate security context, user IDs, volume mounts, and file ownership.
Make a small change and verify recovery
Change one variable at a time. After correcting configuration or probe behavior, observe restart count, readiness, logs, and events over several restart intervals. Recovery is visible when the container remains running, passes readiness checks, and stops generating termination events.
Keep the collected evidence with the incident record. The combination of previous logs, termination reasons, event timing, and configuration snapshots turns a repeated restart into a diagnosable operational problem instead of a guess.